Tracing is a useful technique to find bugs in software, and ftrace is the tracing framework built into the Linux kernel.
But before we start talking about ftrace, let’s define what tracing is.
What is tracing?
Tracing is the specialized use of logging to record information about a program’s flow of execution.
You know when you add print messages in your code to debug it? You are tracing the application with your own “tracing system”. The debug messages added to the code are static tracepoints, and your “trace system” might send the debug messages to the program’s standard output or a log file.
Well, that works. But does not scale. Every time you want to trace some part of the code, you will have to add new debug messages and rebuild it. And you do not have much control over where the messages go. What if you want to save them to analyze later? What if you want to filter the messages? And the code will be a mess, with lots of print statements (you will have to be very careful to not commit any code with debug messages, right?).
The fact is that most of the time we don’t need to add debug messages to the code because there are already tracing tools and frameworks that can do that for us.
That’s where ftrace comes in…
What is ftrace?
Ftrace is a tracing framework for the Linux kernel. It was added to the kernel back in 2008 and has evolved a lot since then.
Ftrace stands for function tracer and basically lets you watch and record the execution flow of kernel functions. It was created by Steven Rostedt, derived from two other tools called latency tracer from Ingo Molnar and Steven’s logdev utility.
With ftrace you can really see what the kernel is doing. You can trace function calls and learn a lot about how the kernel works. You can find out which kernel functions are called when you run a user space application. You can profile functions, measure execution time and find out bottlenecks and performance issues. You can identify hangs in kernel space. You can measure the time it takes to run a real-time task and find out latency issues. You can measure stack usage in kernel space and find out possible stack overflows. You can really do a lot of things to monitor and find bugs in the kernel!
Black magic? Maybe a little. :-) But how does it work?
How does ftrace work?
There are two main types of tracing: static tracing and dynamic tracing.
Static tracing is implemented through static probes added in the source code. They have a low processing load, but the traced code is limited and defined at build time.
Dynamic tracing is implemented through dynamic probes injected into code, allowing to define at runtime the code to be traced. It has a certain processing load, but the range of source code to be traced is much larger.
Ftrace uses a combination of both static probes (function tracing, event tracing, etc) and dynamic probes (kprobes, uprobes, etc).
To trace function calls, ftrace will build the kernel with GCC’s -pg option.
When the kernel is built with -pg, GCC will prepend machine instructions to the prologue of every non-inlined function that will redirect the execution to the ftrace’s trampolines and tracer plugins that perform the actual tracing.
The disassembly listing below is the prologue of the function gpiod_set_value. The call to __gnu_mcount_nc on line 10 was added by GCC and will be used by ftrace to trace the function (this is the same technique used by gprof to profile user space applications).
|
|
Ftrace is also able to trace events in the kernel.
Events are static tracepoints added by developers to monitor kernel subsystems like the scheduler, power management, interrupts, networking, gpio, etc. Just search for functions starting with trace_ in the Linux kernel source code and you will find several places where trace events are used:
$ grep -R trace_ drivers/gpio/*
drivers/gpio/gpiolib.c: trace_gpio_direction(desc_to_gpio(desc), 1, status);
drivers/gpio/gpiolib.c: trace_gpio_value(desc_to_gpio(desc), 0, val);
drivers/gpio/gpiolib.c: trace_gpio_direction(desc_to_gpio(desc), 0, ret);
drivers/gpio/gpiolib.c: trace_gpio_value(desc_to_gpio(desc), 1, value);
drivers/gpio/gpiolib.c:                 trace_gpio_value(desc_to_gpio(desc), 1, value);
drivers/gpio/gpiolib.c: trace_gpio_direction(desc_to_gpio(desc), value, err);
drivers/gpio/gpiolib.c: trace_gpio_direction(desc_to_gpio(desc), !value, err);
drivers/gpio/gpiolib.c: trace_gpio_value(desc_to_gpio(desc), 0, value);
drivers/gpio/gpiolib.c:                 trace_gpio_value(desc_to_gpio(desc), 0, value);
And how do you interface with ftrace?
When tracing is enabled, all collected trace data will be stored by ftrace in a ring buffer in memory.
There is a virtual filesystem called tracefs (usually mounted in /sys/kernel/tracing) to configure ftrace and collect the trace data. All manipulations are done with simple file operations in this directory.
And that’s one thing I like about ftrace. Since the interface to the tracing system is a file system, you can use simple tools like echo and cat to trace the Linux kernel!
So how do you use it?
How to use ftrace?
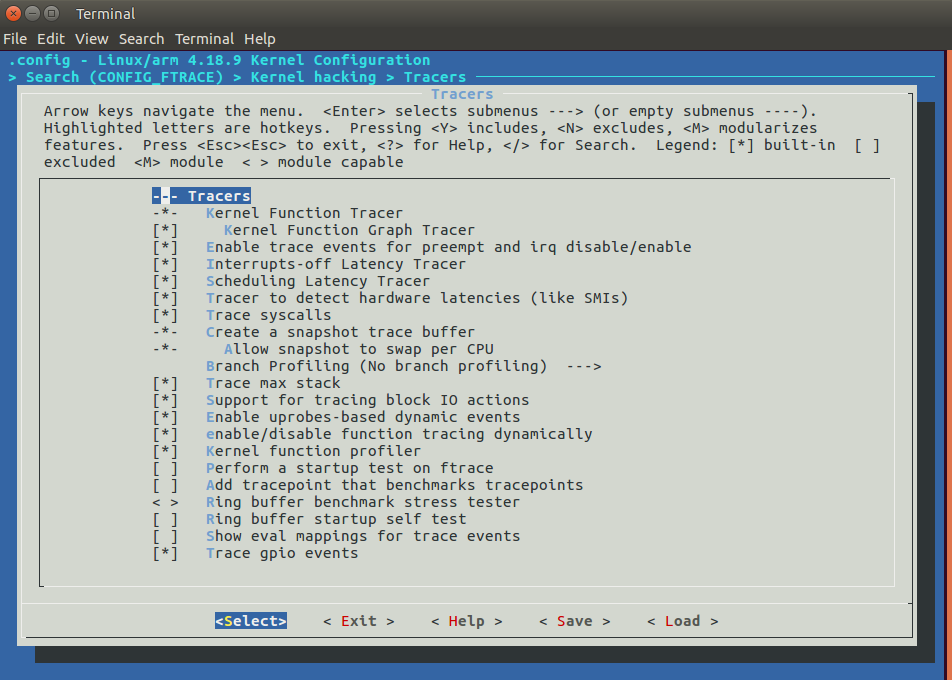
First, we should enable ftrace in the Linux kernel (CONFIG_FTRACE) and all tracers and options we plan to use. This is the menuconfig screen for kernel version 4.18 with most ftrace options enabled:
With ftrace enabled, we can mount the tracefs virtual filesystem:
# mount -t tracefs tracefs /sys/kernel/tracingAnd this is the filesystem interface provided by ftrace:
# ls /sys/kernel/tracing/
README                      set_ftrace_filter
available_events            set_ftrace_notrace
available_filter_functions  set_ftrace_pid
available_tracers           set_graph_function
buffer_size_kb              set_graph_notrace
buffer_total_size_kb        snapshot
current_tracer              stack_max_size
dyn_ftrace_total_info       stack_trace
enabled_functions           stack_trace_filter
events                      timestamp_mode
free_buffer                 trace
function_profile_enabled    trace_clock
hwlat_detector              trace_marker
instances                   trace_marker_raw
max_graph_depth             trace_options
options                     trace_pipe
per_cpu                     trace_stat
printk_formats              tracing_cpumask
saved_cmdlines              tracing_max_latency
saved_cmdlines_size         tracing_on
saved_tgids                 tracing_thresh
set_event                   uprobe_events
set_event_pid               uprobe_profile
We can print the list of available tracers:
# cat available_tracers
hwlat   blk      function_graph   wakeup_dl   wakeup_rt
wakeup  irqsoff  function         nop
There are function tracers (function, function_graph), latency tracers (wakeup_dl, wakeup_rt, irqsoff, wakeup, hwlat), I/O tracers (blk) and many more!
To enable a tracer, we just have to write its name to current_tracer:
# echo function > current_tracerAnd we can read the trace buffer with the trace or trace_pipe file:
# cat trace
# tracer: function
#
#                              _-----=> irqs-off
#                             / _----=> need-resched
#                            | / _---=> hardirq/softirq
#                            || / _--=> preempt-depth
#                            ||| /     delay
#           TASK-PID   CPU#  ||||    TIMESTAMP  FUNCTION
#              | |       |   ||||       |         |
          <idle>-0     [001] d...    23.695208: _raw_spin_lock_irqsave <-hrtimer_next_event_wi...
          <idle>-0     [001] d...    23.695209: __hrtimer_next_event_base <-hrtimer_next_event...
          <idle>-0     [001] d...    23.695210: __next_base <-__hrtimer_next_event_base
          <idle>-0     [001] d...    23.695211: __hrtimer_next_event_base <-hrtimer_next_event...
          <idle>-0     [001] d...    23.695212: __next_base <-__hrtimer_next_event_base
          <idle>-0     [001] d...    23.695213: __next_base <-__hrtimer_next_event_base
          <idle>-0     [001] d...    23.695214: _raw_spin_unlock_irqrestore <-hrtimer_next_eve...
          <idle>-0     [001] d...    23.695215: get_iowait_load <-menu_select
          <idle>-0     [001] d...    23.695217: tick_nohz_tick_stopped <-menu_select
          <idle>-0     [001] d...    23.695218: tick_nohz_idle_stop_tick <-do_idle
          <idle>-0     [001] d...    23.695219: rcu_idle_enter <-do_idle
          <idle>-0     [001] d...    23.695220: call_cpuidle <-do_idle
          <idle>-0     [001] d...    23.695221: cpuidle_enter <-call_cpuidle
The function graph tracer is an alternative function tracer that traces not only the function entry but also the return of the function, allowing you to create a call graph of the function flow and output the trace data in a C-like style with information about the duration of each function.
# echo function_graph > current_tracer

# cat trace
# tracer: function_graph
#
# CPU  DURATION                  FUNCTION CALLS
# |     |   |                     |   |   |   |
 0)   1.000 us    |                } /* idle_cpu */
 0)               |                tick_nohz_irq_exit() {
 0)               |                  ktime_get() {
 0)   1.000 us    |                    clocksource_mmio_readl_up();
 0)   7.666 us    |                  }
 0) + 14.000 us   |                }
 0)               |                rcu_irq_exit() {
 0)   1.334 us    |                  rcu_nmi_exit();
 0)   7.667 us    |                }
 0) ! 556.000 us  |              } /* irq_exit */
 0) # 1187.667 us |            } /* __handle_domain_irq */
 0) # 1194.333 us |          } /* gic_handle_irq */
 0)   <========== |
 0) # 8197.333 us |        } /* cpuidle_enter_state */
 0) # 8205.334 us |      } /* cpuidle_enter */
[...]
Since you are going to gather a lot of data with ftrace, there are several options set up filters. For example, you can set up a filter to trace only a small group of kernel functions. Or you can filter by PID and trace kernel functions called only by a specific process.
In the example below, we are tracing only functions from an RTC device driver:
# echo "snvs*" > set_ftrace_filter
# echo function > current_tracer
# cat trace_pipe
      Binder_3-836   [000] ...1  5890.663049: snvs_rtc_set_time <-rtc_set_time
      Binder_3-836   [000] ...1  5890.663063: snvs_rtc_enable <-snvs_rtc_set_time
      Binder_3-836   [000] ...1  5890.663106: snvs_rtc_enable <-snvs_rtc_set_time
   kworker/0:0-2128  [000] ...1  5890.663215: snvs_rtc_read_time <-__rtc_read_time
You can also enable just specific events like scheduling or system calls. In the example below, we are tracing only GPIO events:
# echo 1 > events/gpio/enable
# cat trace_pipe
         mmcqd/2-103   [000] d..2   778.002889: gpio_value: 73 get 0
         mmcqd/2-103   [000] d..2   778.002910: gpio_value: 73 get 0
         mmcqd/2-103   [000] d..2   778.007575: gpio_value: 73 get 0
         mmcqd/2-103   [000] d..2   778.013398: gpio_value: 73 get 0
We can also use ftrace to measure latencies in kernel space like how long interrupts are disabled or how long it takes a (real-time) process to run after it is woken.
It is nice to be able to use simple tools like cat and echo to trace the Linux kernel. But sometimes we have to write to several files to set up a tracing session. In that case, we can use the trace-cmd tool.
trace-cmd tool
trace-cmd is a user-space command-line tool for ftrace created by Steven Rostedt.
It is a front-end to the tracefs filesystem and can be used to configure ftrace, read the trace buffer and save the data to a file (trace.dat by default) for further analysis.
# trace-cmd

trace-cmd version 2.6.1

usage:
  trace-cmd [COMMAND] ...

  commands:
     record - record a trace into a trace.dat file
     start - start tracing without recording into a file
     extract - extract a trace from the kernel
     stop - stop the kernel from recording trace data
     restart - restart the kernel trace data recording
     show - show the contents of the kernel tracing buffer
     reset - disable all kernel tracing and clear the trace buffers
     report - read out the trace stored in a trace.dat file
     stream - Start tracing and read the output directly
     profile - Start profiling and read the output directly
     hist - show a historgram of the trace.dat information
     stat - show the status of the running tracing (ftrace) system
     split - parse a trace.dat file into smaller file(s)
     options - list the plugin options available for trace-cmd report
     listen - listen on a network socket for trace clients
     list - list the available events, plugins or options
     restore - restore a crashed record
     snapshot - take snapshot of running trace
     stack - output, enable or disable kernel stack tracing
     check-events - parse trace event formats
For example, the command below will start a function tracing:
# trace-cmd start -p functionAnd the command below will trace GPIO events:
# trace-cmd start -e gpioWe can also trace a specific process and record the tracing data to a file:
# trace-cmd record -p function -F ls /
  plugin 'function'
CPU0 data recorded at offset=0x30d000
    737280 bytes in size
CPU1 data recorded at offset=0x3c1000
    0 bytes in size

# ls trace.dat
trace.dat
We can show the tracing data with the report command:
# trace-cmd report
CPU 1 is empty
cpus=2
              ls-175   [000]    43.359618: function:             mutex_unlock <-- rb_simple_write
              ls-175   [000]    43.359624: function:             __fsnotify_parent <-- vfs_write
              ls-175   [000]    43.359625: function:             fsnotify <-- vfs_write
              ls-175   [000]    43.359627: function:             __sb_end_write <-- vfs_write
Or we can open it with KernelShark.
KernelShark
KernelShark is a graphical tool that works as a frontend to the trace.dat file generated by the trace-cmd tool.
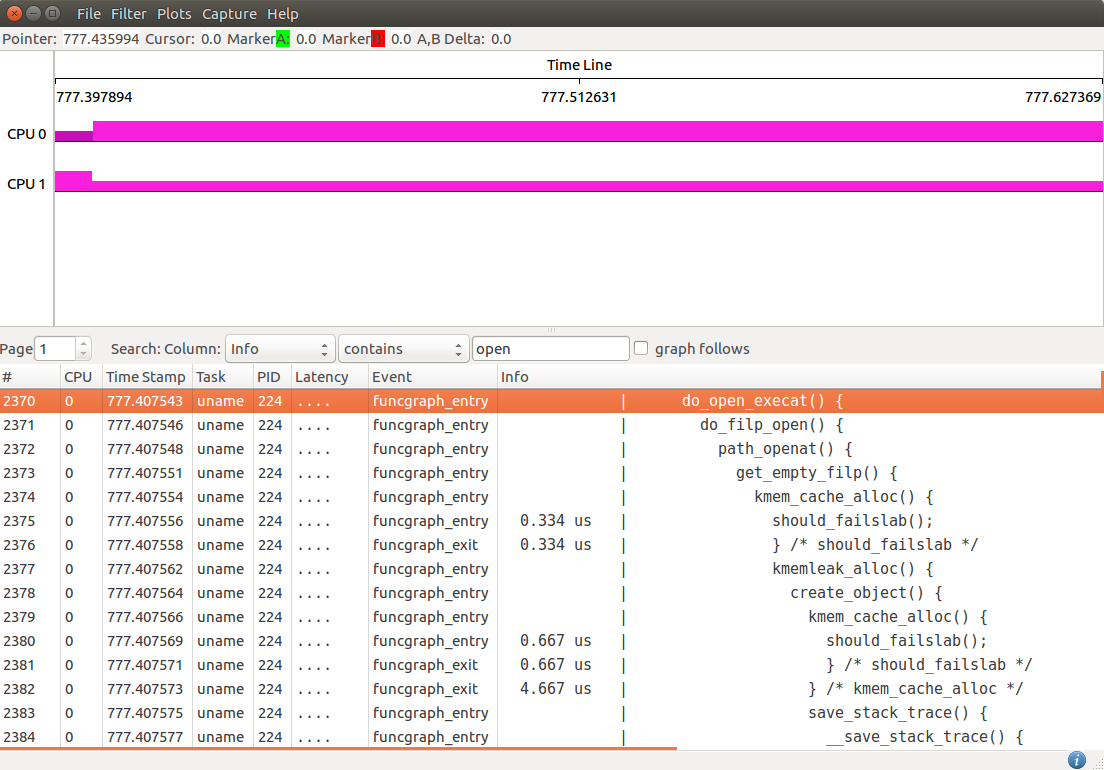
The application has two main viewing areas. The top half is a graphical display of the data and the bottom half is a list view of each event.
The graph view shows graphical plots of the data (per CPU or task). You may zoom in or out into a given location to see the details of events on a specific time frame. The list view in the bottom half has filter options to help analyze the trace data.
More information is available in the KernelShark documentation.
We have seen here trace-cmd and KernelShark, but many more tools use ftrace nowdays, including perf and kernel live patching implementations.
If you want to know more, read the Linux kernel tracing documentation and the ftrace documentation.
There are also very good talks on YouTube by Steven Rostedt, including Understanding the Linux Kernel via Ftrace, See what your computer is doing with Ftrace utilities, Learning the Linux Kernel with tracing and ftrace: Where modifying a running kernel all started.
Although this article does not explore ftrace in detail, it is the basis for future articles where I will explore ftrace to measure latencies and identify different kind of problems in kernel space.
Please email your comments or questions to hello at sergioprado.blog, or sign up the newsletter to receive updates.