One of the most effective ways to identify problems in applications that crash is through core dump analysis.
Core dump is a disk file that contains an image of a process’s memory at the moment of its termination, generated by the Linux kernel when processing some signals like SIGQUIT, SIGILL, SIGABRT, SIGFPE and SIGSEGV.
For example, a core file could be generated when an application crashes due to invalid memory access (SIGSEGV).
With a core file, we can use the debugger (GDB) to inspect the state of the process at the moment it was terminated and to identify the line of code that caused the problem.
Let’s say you run nano and get a “Segmentation fault” error:
# nano
Segmentation fault
That’s a situation where a core dump file could be produced, but it’s not by default.
For the core file to be produced, we need to configure the RLIMIT_CORE (core file size) resource limit for the process, which is set to 0 by default.
To change this setting we can use the ulimit command:
# ulimit -c unlimitedNow just run the application again and the core file will be produced:
# nano
Segmentation fault (core dumped)

# ls
core
By default, a file named core will be produced in the application’s working directory. This behavior can be changed writing to /proc/sys/kernel/core_pattern.
If the core file isn’t produced, check if the user has write permission on the directory and if the filesystem has enough space to store the core dump file.
Now we just have to run GDB with the application’s core dump file and the executable built with debugging symbols (in my case, I’m working with an ARM platform, so I’ve used a cross-compilation toolchain):
$ arm-linux-gdb -c core nano
Core was generated by `nano'.
Program terminated with signal SIGSEGV, Segmentation fault.
#0  0x00019f14 in signal_init () at nano.c:1192
1192		*sig = SIGINT;
As you can see, GDB pointed to the line of code that caused the problem (nano.c:1192).
For a better view of the source code, we can open GDB in TUI mode:
$ arm-linux-gdb -c core nano -tui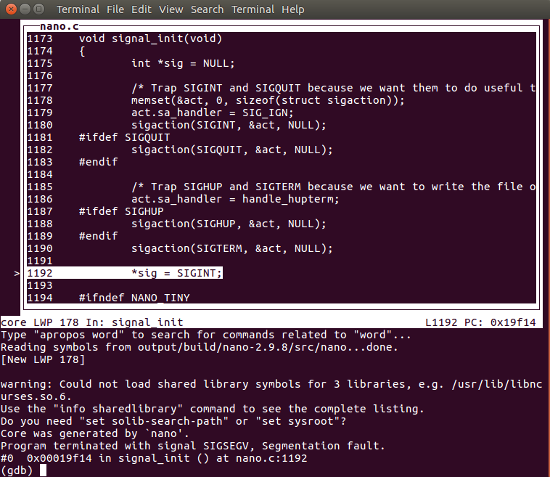
Since the core file is a snapshot of the memory when the application crashed, we can inspect all process memory, like displaying a variable or the stack backtrace.
(gdb) print sig
$1 = (int *) 0x0

(gdb) bt
#0  0x00019f14 in signal_init () at nano.c:1192
#1  0x0001b264 in main (argc=1, argv=0xbee9de64) at nano.c:2568
More information on core dump generation and analysis are available on the core man page.
$ man 5 coreHappy debugging!
Please email your comments or questions to hello at sergioprado.blog, or sign up the newsletter to receive updates.