In this article, we will learn how to debug the Linux kernel on an embedded Linux system with GDB.
GDB is a powerful and versatile tool for debugging C and C++ programs, including the Linux kernel. However, debugging a kernel is more complex than debugging user-space applications due to the kernel’s low-level nature and its direct interaction with hardware (i.e. we want to use the kernel to debug itself!).
This could be solved with some hardware support like JTAG. But that would require a JTAG interface available on the target platform, a JTAG adapter and some additional software like OpenOCD.
Although JTAG might be necessary for low-level tasks like board bring-up (i.e. debugging the bootloader or the kernel early initialization), it usually implies a complicated setup, and for most situations, it is not really required.
That is because the Linux kernel has integrated support for debugging with GDB, in a client/server architecture. Linux has an implementation of the GDB remote protocol called KGDB, which can communicate remotely with a GDB client application running on the host:
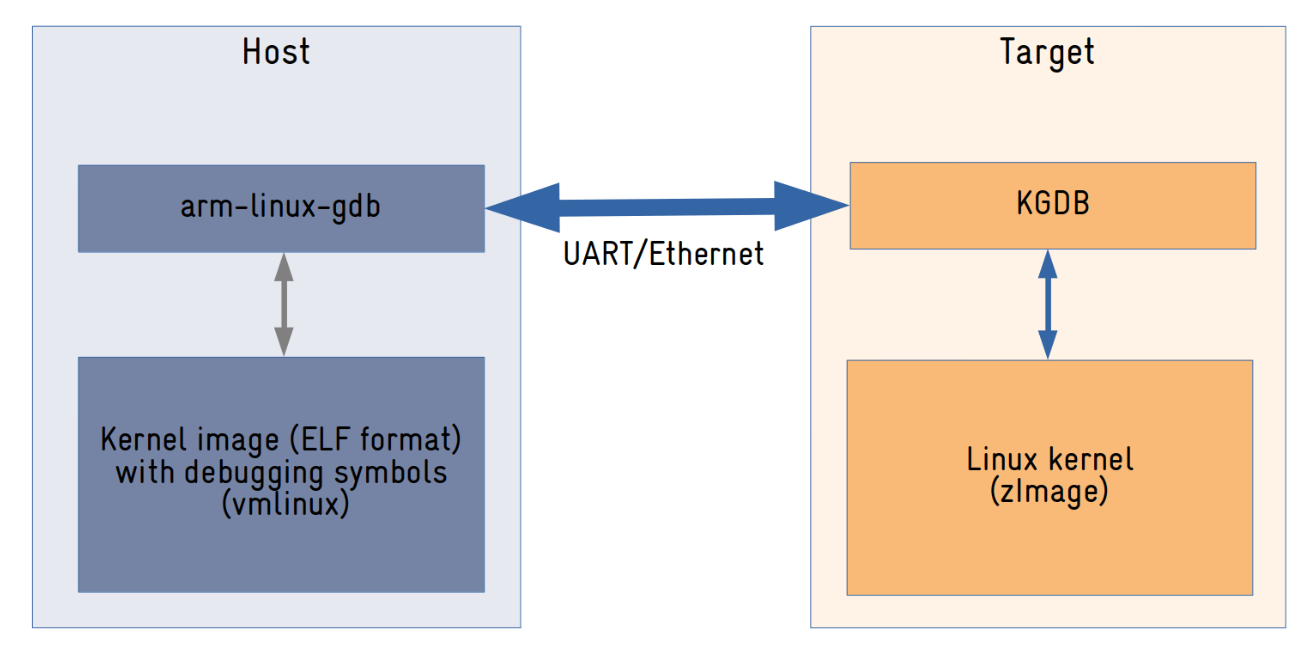
KGDB is a GDB remote protocol implementation built into the Linux kernel that communicates with a host running a GDB client application via a serial port or network interface (the support for serial ports is integrated into mainline, but the support for communicating over a network interface requires a patch).
KGDB allows full control over the execution of the kernel on the target, including reading and writing to memory, step-by-step code execution, and adding breakpoints in both process and interrupt context!
So let’s see how this works…
My test environment
For the tests, I am using a BeaglePlay development board.
I built a toolchain and a small rootfs with Buildroot, and I am running Linux version 6.7.0 from the mainline repository:
# uname -a
Linux buildroot 6.7.0-09929-gcceb74d01d67 #3 SMP PREEMPT Mon Jan 15 11:21:44 -03 2024 aarch64 GNU/Linux
To configure the debugging infrastructure with GDB, there are three steps:
- Compile the kernel with KGDB support.
- Start the kernel debugger (KGDB) in the target.
- Connect to the kernel debugger using a GDB client in the host.
Let’s start by enabling KGDB support in the Linux kernel.
Configure the kernel with KGDB support
To use KGDB, it is necessary to build the kernel with a few configuration options enabled:
- CONFIG_KGDB: this is the main option to enable KGDB support.
- CONFIG_KGDB_SERIAL_CONSOLE: enables the KGDB serial port driver.
- CONFIG_MAGIC_SYSRQ: enables the Magic SysRq key feature, used to enter the kernel debugger (i.e. start KGDB).
- CONFIG_DEBUG_INFO: compiles the kernel with debugging symbols.
- CONFIG_FRAME_POINTER: frame pointers improve the debugging experience (this option is usually enabled by default if supported by the architecture).
Also, it is recommended to disable a few configuration options:
- CONFIG_DEBUG_INFO_REDUCED: this should be disabled so debugging information for structure types is generated in the kernel ELF image.
- CONFIG_RANDOMIZE_BASE: if the architecture you are working on supports KASLR (Kernel Address Space Layout Randomization), you might want to disable this option. KASLR is a feature that enhances security by randomizing the memory address layout of the kernel but can affect the debugging experience. Alternatively, you can also pass nokaslr as a boot parameter to the Linux kernel.
After rebuilding the kernel, you might want to check if the generated ELF image (vmlinux) has debugging symbols (search for the ‘with debug_info, not stripped’ message):
$ file vmlinux
vmlinux: ELF 64-bit LSB pie executable, ARM aarch64, version 1 (SYSV), statically linked, BuildID[sha1]=2a037fabfe700ab603bcf3579909b1d41785b4fb, with debug_info, not stripped
At runtime, you can confirm if KGDB is available by checking for the existence of the /sys/module/kgdboc directory:
# ls /sys/module/kgdboc/
parameters  uevent
With KGDB enabled, the next step is entering the kernel debugger (i.e. starting KGDB).
Entering the kernel debugger
There are two possible ways to get the kernel into debug mode: at boot time or runtime.
To enter debug mode at boot time, we need to pass kgdboc and kgdbwait boot parameters to the Linux kernel. Example:
kgdboc=ttyS2,115200 kgdbwaitThis is usually done via the bootloader (e.g. U-Boot or Grub). Be aware that, in the example above, you might need to change the name of the serial port to match your target platform (ttyS2 is BeaglePlay’s default console).
Entering the kernel debugger at boot time might be useful to debug the kernel boot process. But if you want to debug the kernel at runtime, it might be better to enter the kernel debugger at runtime.
In this case, there is no need to pass boot parameters to the Linux kernel.
You have to first configure the serial port that is going to be used to debug the kernel:
# echo ttyS2 > /sys/module/kgdboc/parameters/kgdboc
[   15.733994] KGDB: Registered I/O driver kgdboc
Again, be aware that you might need to change the name of the serial port to match your target platform.
After that, you can enter the kernel debugger via a SysRq command:
# echo g > /proc/sysrq-trigger
[   28.708009] sysrq: DEBUG
[   28.710921] KGDB: Entering KGDB
At this point, the system will freeze into KGDB and wait for a remote connection. Now it is time to connect to it using a GDB client in the host machine.
Connecting to KGDB
Now you need to use the GDB client application from your cross-compiler toolchain.
You have to execute GDB, passing the kernel ELF image with debugging symbols (vmlinux):
$ aarch64-linux-gdb vmlinux -tuiThe -tui parameter will start GDB in TUI (Text User Interface) mode. This is a nice feature that will display a window with the source code on top of the GDB command-line interface.
In GDB’s command-line interface, configure the serial port:
(gdb) set serial baud 115200And connect to KGDB running in the target:
(gdb) target remote /dev/ttyUSB0GDB will connect to KGDB and the debugging process will start automatically:
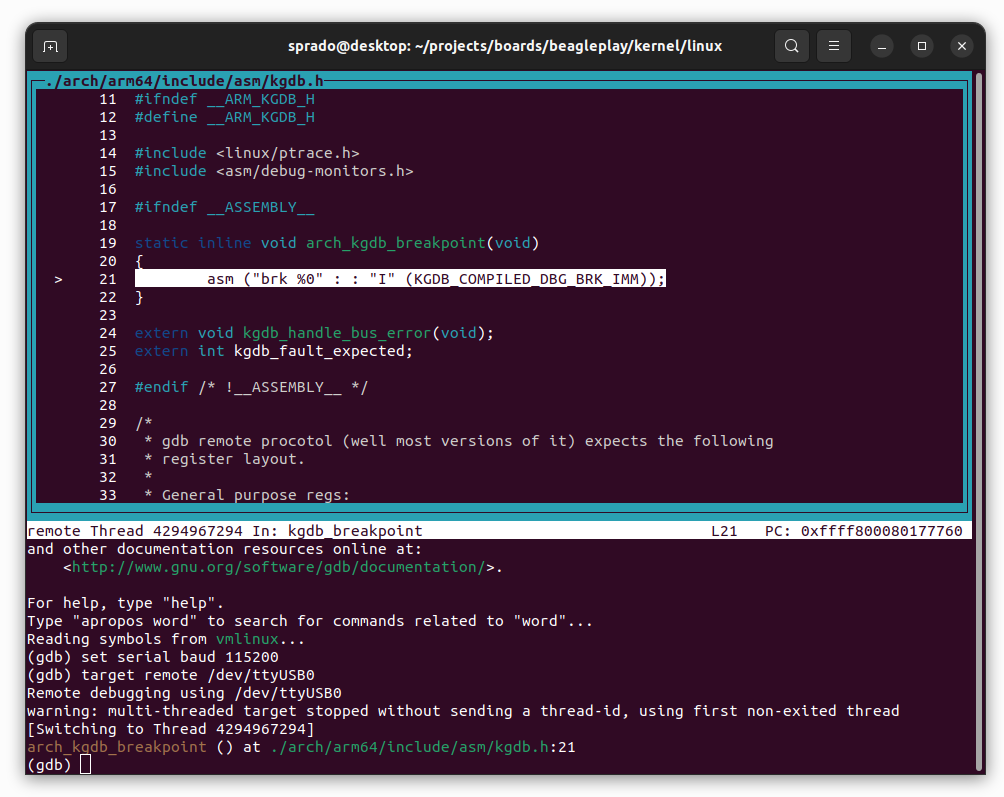
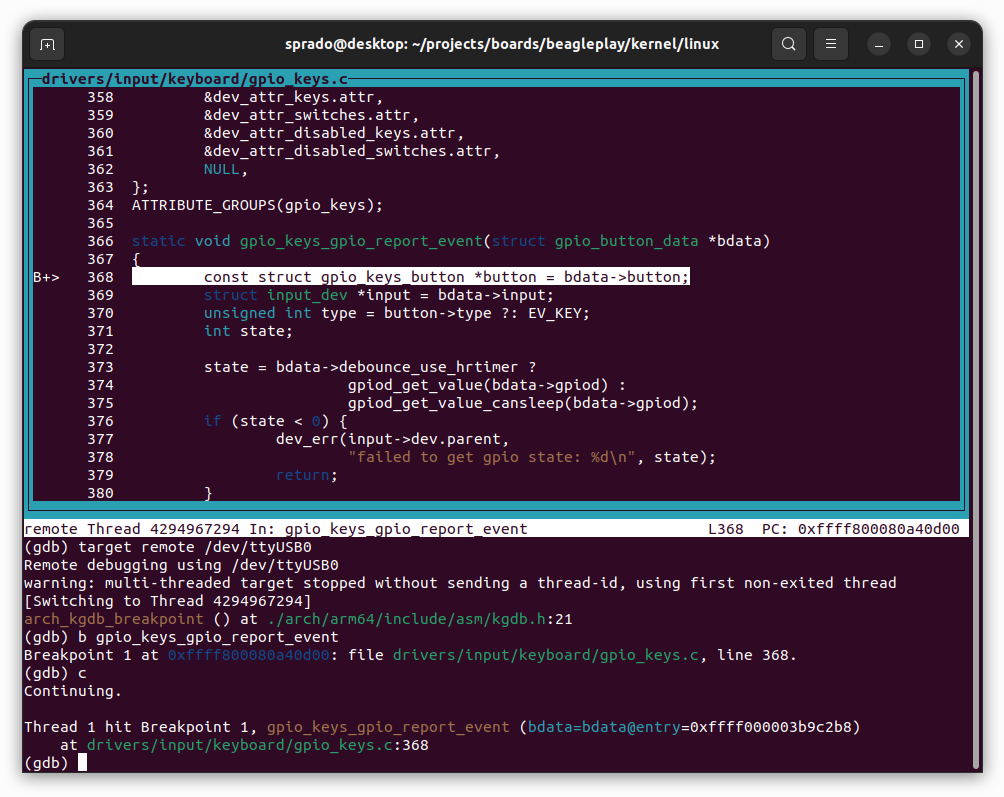
At this point, the kernel execution is stopped. You can add breakpoints to the code you want to debug and type continue to run the kernel.
As an example, I added a breakpoint at the gpio_keys_gpio_report_event() function and executed continue to run the kernel. Then I pressed the USER button from the BeaglePlay development board and the execution of the kernel was interrupted. Now I can step through code, inspect memory and variables, and so forth, just like we would with a regular application!
Another nice thing is that, if a crash occurs when GDB is connected to KGDB, the kernel will automatically stop executing in the line of code that caused the crash, and GDB will show the line for you. This simplifies crash analysis in kernel space, since you can easily inspect memory, navigate through the frames in the stack, and so on.
Once the debugging process is over, you can disconnect from KGDB with the detach command:
(gdb) detachNow, if you are not a fan of command-line interfaces and prefer a graphical tool for debugging, that should not be a problem!
Debugging the Linux kernel with Visual Studio Code
Visual Studio Code is a very popular, lightweight and powerful source code editor, and configuring it as a front-end for GDB should not be a problem.
First, make sure you have the C/C++ extension from Microsoft installed.
Then start Visual Studio Code inside the Linux kernel source code, press Ctrl+Shift+D, click on “create a launch.json file” and select “C++ (GDB/LLDB)”.
Add the following code to the launch.json file:
{
    "version": "0.2.0",
    "configurations": [
        {
            "name": "Remote debug the Linux kernel",
            "type": "cppdbg",
            "request": "launch",
            "program": "${workspaceFolder}/vmlinux",
            "cwd": "${workspaceFolder}",
            "externalConsole": false,
            "MIMode": "gdb",
            "miDebuggerPath": "aarch64-linux-gdb",
            "setupCommands": [
                {
                    "text": "file vmlinux",
                },
                {
                    "text": "target remote /dev/ttyUSB0",
                }
            ]
        },
    ],
}
In the code above, you might need to change the miDebuggerPath property and the serial port name (/dev/ttyUSB0) to match your development environment.
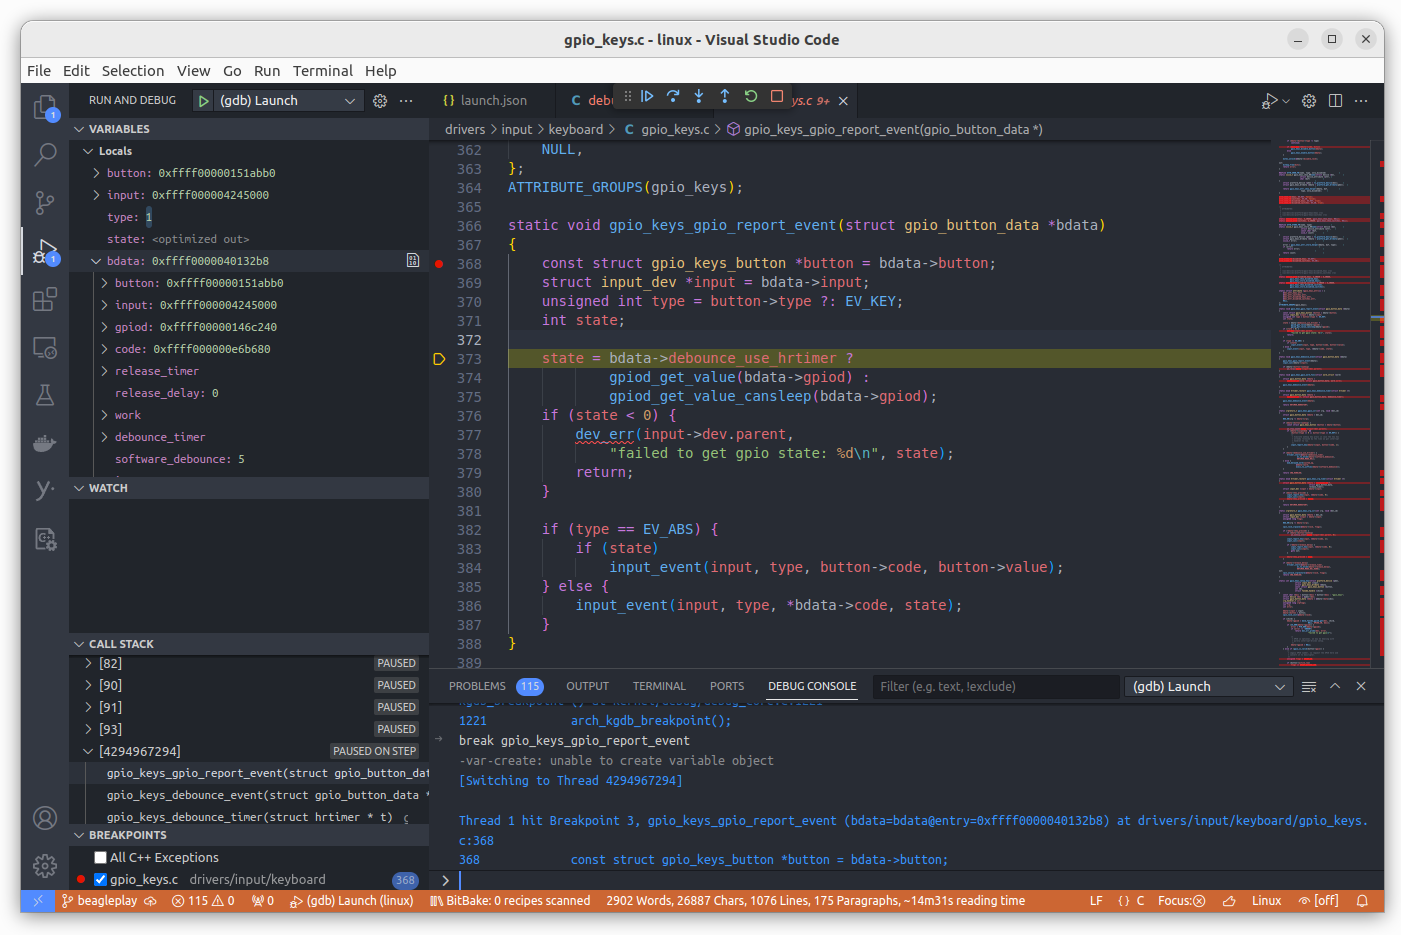
Now start KGDB in the target and press F5 in Visual Studio Code.
After a few seconds, Visual Studio Code will use GDB to connect to KGDB, and you will be able to debug the Linux kernel inside Visual Studio Code!
Sharing the serial port
One challenge we might have is the lack of a dedicated serial port for the debugging connection.
It is usually common on development boards to have a serial port for the console, and if you want to use it for debugging, you’re gonna lose the console.
This can be worked around by a dedicated proxy program, responsible for managing the serial port communication, and capable of separating the data transmitted and received from the console and the GDB connection.
There is one such tool provided by the Linux kernel community called kdmx:
$ git clone https://kernel.googlesource.com/pub/scm/utils/kernel/kgdb/agent-proxy
$ cd agent-proxy/kdmx/
$ make
gcc -Wall -Wunreachable-code -D_XOPEN_SOURCE -c -o kdmx.o kdmx.c
gcc -o kdmx kdmx.o
This program will open the serial port and create two pseudo tty’s, one for the console and the other for KGDB:
$ ./kdmx -p /dev/ttyUSB0 -b 115200
/dev/pts/8 is slave pty for terminal emulator
/dev/pts/9 is slave pty for gdb

Use <ctrl>C to terminate program
Now you just have to connect your favorite serial port communication tool (e.g. minicom) to the first pseudo tty, and GDB to the second one.
KDB
Let’s say you want to debug the kernel, but don’t want to use a remote machine for it. In this case, you can use KDB, a KGDB front-end built into the Linux kernel.
KDB provides a command-line interface to KGDB, making it possible to debug the kernel (at the assembly level) without a remote connection!
To use KDB, we just have to compile the kernel with CONFIG_KGDB_KDB enabled.
Then, when entering the kernel debugger, the KDB command-line interface will automatically be displayed in the console:
[0]kdb>The help command can be executed to list all available commands:
[3]kdb> help
Command         Usage                Description
----------------------------------------------------------
md              <vaddr>             Display Memory Contents, also mdWcN, e.g. md8c1
mdr             <vaddr> <bytes>     Display Raw Memory
mdp             <paddr> <bytes>     Display Physical Memory
mds             <vaddr>             Display Memory Symbolically
mm              <vaddr> <contents>  Modify Memory Contents
go              [<vaddr>]           Continue Execution
rd                                  Display Registers
rm              <reg> <contents>    Modify Registers
ef              <vaddr>             Display exception frame
bt              [<vaddr>]           Stack traceback
btp             <pid>               Display stack for process <pid>
bta             [<state_chars>|A]   Backtrace all processes whose state matches
btc                                 Backtrace current process on each cpu
btt             <vaddr>             Backtrace process given its struct task address
env                                 Show environment variables
set                                 Set environment variables
help                                Display Help Message
?                                   Display Help Message
cpu             <cpunum>            Switch to new cpu
kgdb                                Enter kgdb mode
ps              [<state_chars>|A]   Display active task list
pid             <pidnum>            Switch to another task
reboot                              Reboot the machine immediately
lsmod                               List loaded kernel modules
sr              <key>               Magic SysRq key
dmesg           [lines]             Display syslog buffer
defcmd          name "usage" "help" Define a set of commands, down to endefcmd
kill            <-signal> <pid>     Send a signal to a process
summary                             Summarize the system
per_cpu         <sym> [<bytes>] [<cpu>]
                                    Display per_cpu variables
grephelp                            Display help on | grep
bp              [<vaddr>]           Set/Display breakpoints
bl              [<vaddr>]           Display breakpoints
bc              <bpnum>             Clear Breakpoint
be              <bpnum>             Enable Breakpoint
bd              <bpnum>             Disable Breakpoint
ss                                  Single Step
dumpcommon                          Common kdb debugging
dumpall                             First line debugging
dumpcpu                             Same as dumpall but only tasks on cpus
You can use KDB to inspect memory, registers, list processes, display the logs, and even set breakpoints to stop in a certain location. KDB is not a source-level debugger, although you can set breakpoints and execute some basic kernel run control.
For additional information on how to use kgdb and kdb to debug the Linux kernel, you can always check the kernel documentation.
Please email your comments or questions to hello at sergioprado.blog, or sign up the newsletter to receive updates.